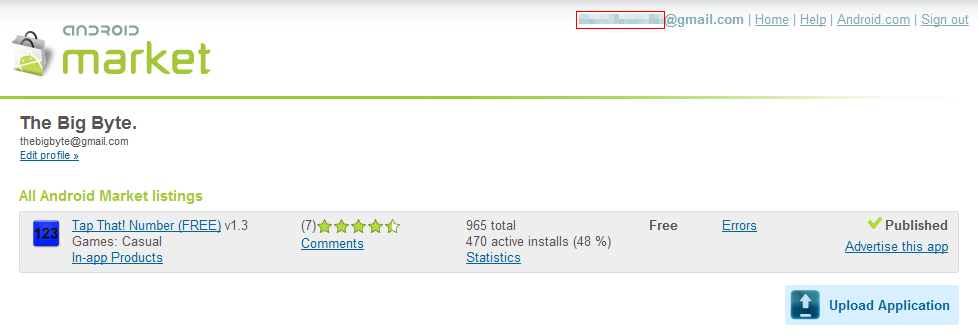
 It’s been one month now since I published my first app on the Android market. I thought this would be a great time to share some stats from the first few weeks – how many downloads, how much revenue from AdMob, user engagement figures – all that stuff. Hopefully this will give you some idea of how far I’ve come with this first app in one month, and what opportunity there is for further growth. There are plenty of screenshots, so you’ll get to see exactly what has been happening in detail.
Android Market Stats
First up – a bit of history. On April 3rd I uploaded a demo game to the Android Market. This was purely an experiment to see how many people were interested enough to download the preview version. In hindsight, this probably hurt my long-term download figures, but it was an interesting exercise nonetheless. Nearly 100 people downloaded this demo in the first 24 hours.
On April 8th I uploaded the first release version of Tap That! Number. For this release I was expecting similar download numbers to the demo version, but the actual figures were quite underwhelming. Take a look at the graph for the first couple of weeks (starting from the demo release):
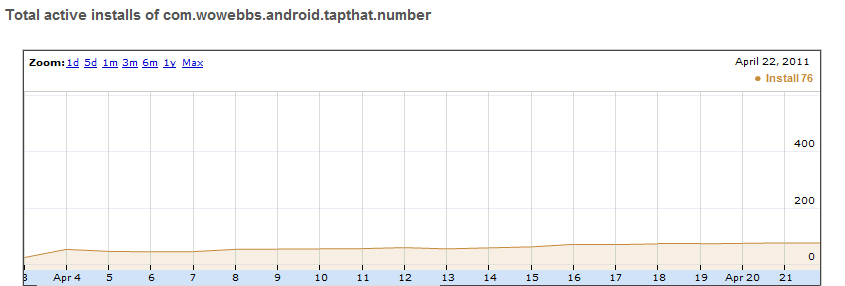
As you can see, there was a bit of movement from April 3-4 when the demo was released, but when I published the full version on April 8 there was hardly any change. In fact, there were only a few downloads per day all the way to April 22, by which time there were about 78 total active installs. Not entirely bad for a first app – but I was expecting better.
On April 23, I released the first update – version 1.1. Boy, did that make a difference! Within the next 48 hours, I had a total of 327 active installs. That’s about 100 downloads per day, compared with 3 or 4 per day previously. Why the sudden jump in popularity? It seems that this time, my app was listed in the “Just In” category on the Android Market for a substantial length of time. This meant it was exposed to many more people, ultimately resulting in the increased download numbers.
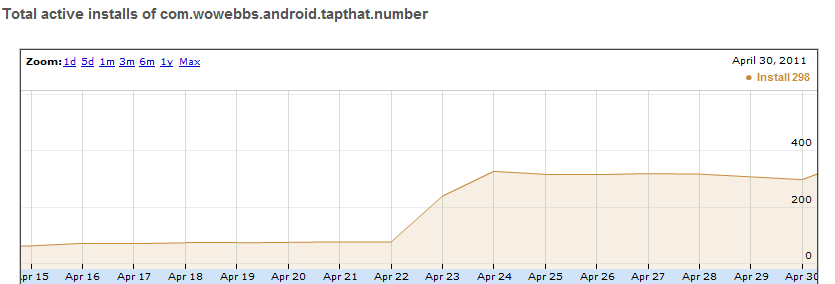
As more apps were released of course, Tap That! Number was pushed further down the list, and downloads tapered off again. Most importantly however, active installs did stay relatively level for the next few days. This was a good sign, as it meant people weren’t uninstalling the app en masse!
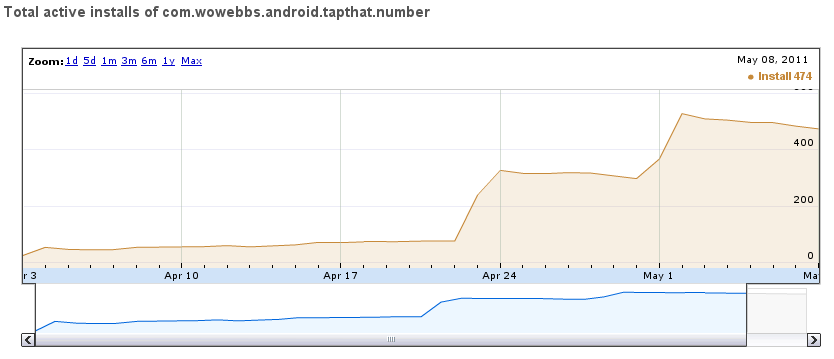
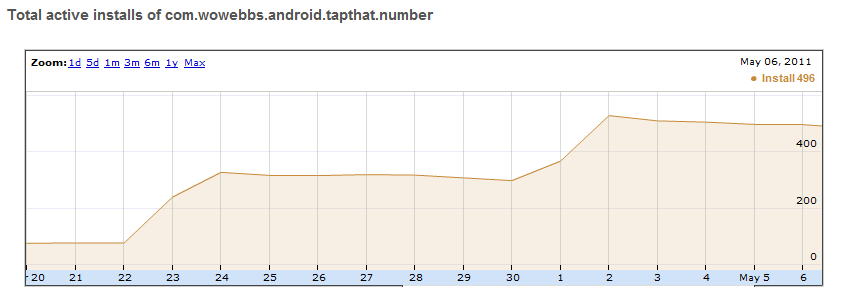
On May 1, I released another minor update, to see if I could repeat the success from a week before. Again, the install graph tells the story best – 200 new users in two days:
Third Party Analytics
Along with one of my later updates, I added Google Analytics tracking to the app. I highly recommend using Google Analytics to track any Android app you intend to distribute. It’s very simple to add the library to your code, and the data collected complements the information available from Google’s Developer Console.
For Tap That! Number, I added event tracking to count the number of “clicks” on each menu item. As an example, the screenshot below shows clicks from the Main Menu for the week after installing the tracking code:

These kind of stats are a wealth of information, which you can use to improve app functionality, or just enjoy watching the hits pour in 😉 One thing I learned from these stats is that nearly everyone who plays one game will click the “Restart” button and play again. Initially I was debating whether or not to add the button, as I wasn’t sure how many people would actually use it. Thanks to Google Analytics, I now have an answer.
Just a few days ago I added Flurry analytics alongside the Google tracking system. It’s a little too early to share any data yet, but in the next month I’ll be evaluating both of them side-by-side. Flurry offers more in-depth statistics about target devices, and application versions. It also includes an integrated error reporting and tracking system, which could come in handy if a large number of errors are being reported from a particular device.
In-App Advertising
I’ve been running AdMob advertising at the bottom of each menu screen, and just above the game board when a game is in progress.
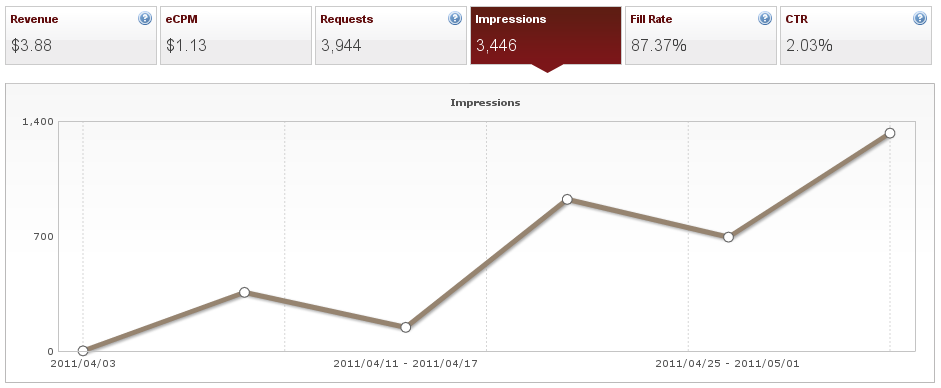
I’ve been getting a pretty high click-through rate – just over 2%. That’s likely to change as the number of impressions increases, but for now I’m getting an average of $1.13 for every 1,000 impressions. Overall the advertising revenue for this month has been a solid start. Based on the current figures of 937 total installs and $3.88 revenue, I’ve made $0.0249 (two cents) revenue for every install.
Conclusion
So, in summary, this month has seen:
- Total Installs: 965
- Active Users: 470
- Games Played Per Week: ~2,900
- AdMob Impressions: 3,446
- AdMob Revenue: $3.88
I’m quite happy with the overall progress, and it’s given me plenty of opportunities to learn. From Google Analytics to AdMob and ScoreNinja, there are several third-party libraries which have integrated nicely. The advertising revenue is off to a good start too. Thanks to everyone who has emailed their support – your kind comments are greatly appreciated! It’s great to know if people find these posts useful (or not!), and if you do have any other comments or questions feel free to send them through. Feedback is always a good thing 🙂
Moving into the next month (just tipped past 1,000 total installs), I plan to update Tap That! Number further, including additional game modes and possibly a custom high score solution. Also, on the agenda: explore Flurry analytics, and maybe even publish another app!
Update: This post was featured on Hacker News – read the follow-up.
Do you have a story about beginning Android development that you’d like to share? Please leave a comment, I’d love to hear from you.
