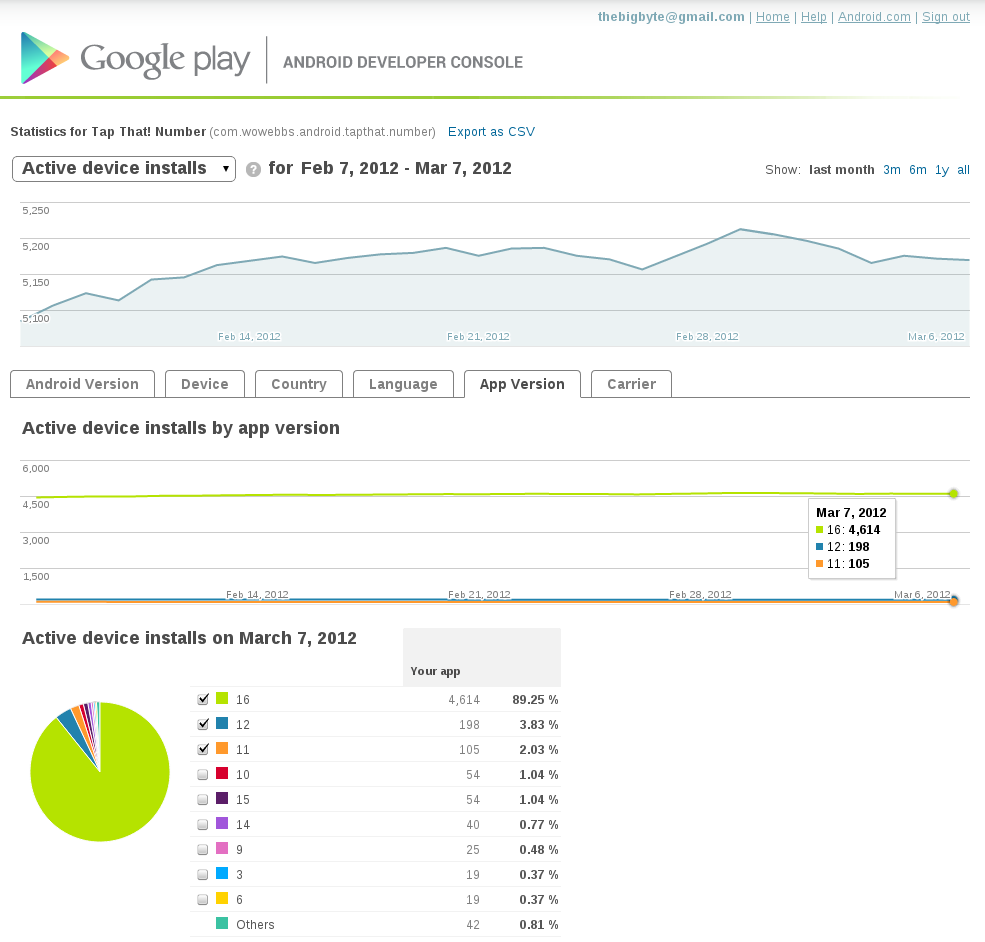
A few days ago (before the Android Market was renamed) Google announced a major update to the Android Developer Console stats page. Rather than the simple “active installs” chart which used to be shown, developers now have access to a wide range of charts showing total & active installs over time. Google has also added the ability to view daily install charts, and see which version of your app users have installed at the present time.
Android developers – if you haven’t checked your developer console in a while, I recommend you log in and try out these new features right now. They’re a vast improvement on what was previously available. There’s even an “Export to CSV” option available, so you can export the data to Excel (or Google Docs) and analyse it yourself.
Very cool.

