 This post is a little late, but I’ll summarise the monthly stats here in order to present the full picture. My second month (9th May – 8th June) has been pretty straightforward, with Tap That! Number seeing regular growth in much the same pattern as the first month. I’ve now diversified a bit, releasing two new apps which has helped bump up the advertising revenue. Work and study commitments prevented me from spending a lot of time in actual development, but I did manage to push a major update to Tap That! Number – a new “memory mode” with hidden tiles. Read on for the full details from this month’s development, and a look at how the Flurry tracking service compares to Google Analytics.
Android Market Downloads
At the start of this month, I had one app published on the Android Market, and my total active installs had just passed 400. Over the course of the month, I released three feature updates & one bug fix for Tap That! Number. I also published an Android client for this blog (powered by the feed.nu service), and a Simple Quotes app (to be used in an upcoming tutorial). For this report I’ll focus on Tap That! Number, because I can’t add any tracking codes to the blog client. Simple Quotes is still very much experimental, and was released partly to gauge the popularity of other sections in the Market. The cumulative stats for all three apps are included in my final summary.
So, for Tap That! Number – as you can see from the screenshot below, there was a definite increase in active installs after every update. However, between updates the number of users actually dropped slightly over time.

I’m a bit disappointed by the dropping numbers when there’s no update. It’s only a very slight decrease, but I would have expected an upwards trend, at least from random searches in the Market. According to Google Analytics, over 70% of games are played by returning users. This seems to indicate people are coming back and playing some time after the initial install. Next month I might have to focus more on generating some publicity outside of the Android Market, to see if I can reverse this trend.

By the end of the month, Tap That! Number had reached 906 active installs, and 2,500 games played per week – about double the figures from last month.
Flurry Analytics
Last month I promised to take a look at Flurry, which is a mobile analytics service similar to Google Analytics. However, Flurry offers a more detailed look at the Android-specific aspects – handset version, screen resolution, app deployment version, and more.
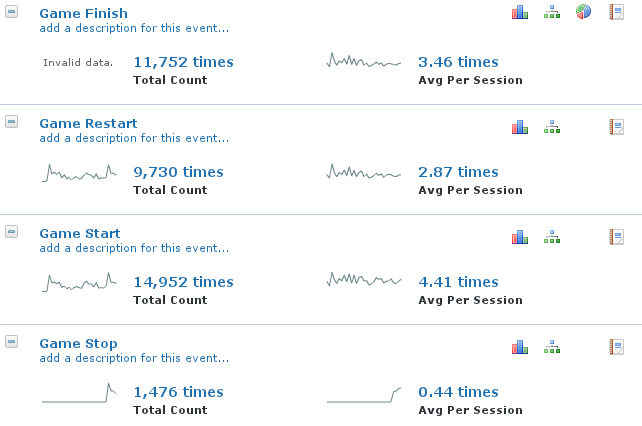
The screenshot below shows my Flurry dashboard for Tap That! Number.

In the code for my Android app, I’ve placed the Flurry tracking code in exactly the same place as Google Analytics. So theoretically, both tracking solutions should report the same basic numbers. As you can see from the graph, the overall shape of the graph is very similar. However, Google Analytics counts nearly 700 more visits than Flurry’s equivalent “Sessions”. That’s a difference of close to 20%.
There’s also a big difference between the “Average Time on Site” (15 minutes) for Google Analytics, and “Median Session Length” (1.6 minutes) for Flurry. Now, I’ll admit that “average” and “median” are two fairly different concepts. But these two figures give entirely different impressions of user engagement – 15 minutes sounds great, whereas 1.6 minutes indicates something needs a lot of work – visitors are not staying around for very long. On the whole, Flurry seems to offer a more conservative overview, whereas Google Analytics will show significantly higher figures on the Dashboard.
Once you drill down to the specific clicks however, both services tell much the same story. Google Analytics reports 12,809 games finished, while Flurry reports 11,752. That’s less than 10% difference, which is much more acceptable.

But Flurry has another trick up it’s sleeve – something that Google Analytics hasn’t yet implemented in any coherent manner. Take a look at the Flurry technical report for Tap That! Number:

There’s a wealth of information available about the actual devices – firmware version, device model, and even whether Wi-Fi is enabled or not. These kind of details can be really useful for a developer. For example, I’ve discovered that about 3% of my monthly users are running Android 1.6. That’s 100 games played per month on the oldest supported Android version. In contrast, over 90% of users are running Android 2.1 or later.
Some of this information is also available from the Android Developer Console. But the best thing about Flurry is that you can drill down and view information from specific Android versions. So if you click on “Android 1.6”, you’ll be able to see graphs and information relating to users with that version of Android. This lets you see the number of errors generated, median session length, and more. Combining metrics like this makes any analytics tool much more powerful, and this is where Flurry’s additional Android-specific data really shines.
I’ll leave the final verdict until I’ve used both tools for a bit longer. But my first impression – Flurry is worth checking out, especially if you want to understand the capabilities of your target devices.
AdMob Earnings
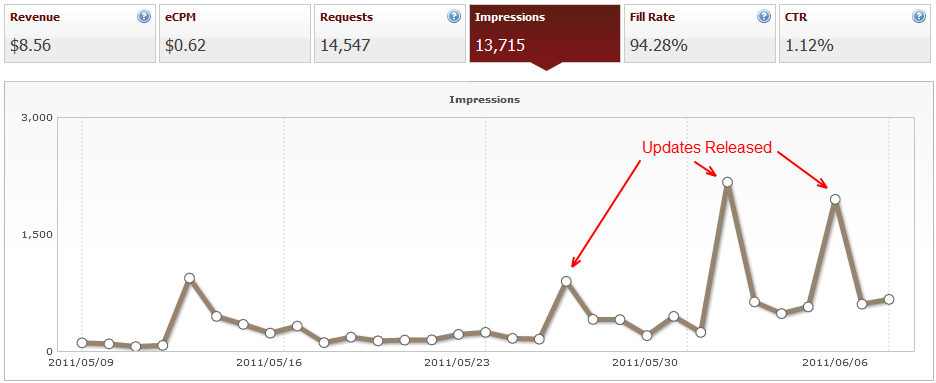
Finally, the financial side of things. AdMob stats. Last month my earnings totalled $3.88. This month: $8.56. That’s an increase of over 100%, or basically double what I earned last month. Still not an amazing figure in itself (how many meals could you buy for under $10?), but it’s another step in the right direction.
Predictably, the increased number of impressions means a greatly reduced eCPM and click-through rate. The eCPM of $0.62 is just over half of last month’s $1.13. This month’s figures seem to align better with the industry average.
The fill rate has also improved – Google enabled AdSense integration for my account, so now the AdMob inventory will fail over to the (much larger) AdSense network. An average fill rate of 94% is quite workable.

Summary
This month was pretty much “smooth sailing”, with growth in all the key areas, but no major changes to speak of. I learned a lot, both from app development and also the research involved for this website. Ironically, I think I’ve learned as much about WordPress since starting this blog as I have about Android! 🙂 If people are interested, I might look at writing another post about how this website is going itself.
Next month is already gearing up to be an exciting one, partly due to being featured on Hacker News and Reddit. It will also be the first time I include advertising revenue from this website in my income report. But for now, without further ado, here is the final summary from my second month on the Android Market:
Monthly Development Summary:
- Total apps: 3 (+200%)
- Total installs (cumulative): 2251 (+142%)
- Total installs (active): 1067 (+115%)
- Total ad impressions: 13,715 (+298%%)
- Total earnings: $8.56 (+120%)